Quantum Mechanics may not be everybody’s cup of tea, but today’s servings are laced with sweeteners that make a cup worth sipping.
Students always have a spot reserved in their attention span for graphics or visual representations. That’s why, IMHO, vector addition is best taught with the graphical (e.g. polygon and parallelogram) method as an introduction to the component method, or ray tracing as a prelude to the analytical methods in geometrical optics. The seemingly sophisticated image of quantum mechanics (QM) is no exception to this rule.
Allow me to elaborate. It is usually a given that introductory books on QM contain figures showing wave functions and probability distributions (ex: 1; 2); usually that of the particle in a box. Probably even earlier in the text of a typical modern physics book, in the discussion on uncertainty relations, figures can be found showing how a series of sinusoidal waves of different wavelengths , a.k.a. a Fourier Series, can make up a wave packet. These figures can easily be generated by simple programs which can even enable the student to change certain values to see how the graphs would look like when these changes are implemented. While practically any programming language that can support basic graphics can be used for this purpose, I will focus only on Java as the language of choice since this is what I am most familiar with. My next two articles deal with the type of figures that I just mentioned, so please do drop by again next week.
It might be straightforward to show the basic principle of a particular time-independent problem using either a single or a short series of figures for the wave function and the probability distribution. However, it wouldn’t be as easy if we wanted to talk about time-independent ones. This is clearly a job for simulations. Programs that show simulations of time-dependent wave functions can be more sophisticated to write but there are already existing applications that we can use. The best thing is that, they’re free. While there are definitely other sites that allow you to download similar applications, I recommend you start with http://www.compadre.org/osp/. It houses packages that combine computer simulations with tutorial materials and student worksheets. The simulations included in these packages are written in Java. Hence, one has to have the Java Virtual Machine (JVM) for the applications to run in his/her operating system.
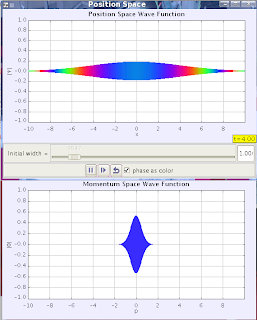
Simulations temporarily take the math (and the burden of plotting) out of the equation and let you focus on the physics part of a particular problem. Consider the simple particle in a box problem. By changing values of n in the program, one can automatically see how the wave function and the probability distribution varies. Below are screenshots of the Free Particle Wave Packet Program, which shows how a wave packet evolves with time in the position and momentum space. Without having to go through a rigorous mathematical discussion, the user easily sees how the wave packet spreads in position space but remains constant in momentum space. Using simulations as a pedagogical tool allows the learner to experience the event and empowers him to make observations of his own. These observations can later be verified in his readings or mathematical derivations. Regardless of whether he interprets all his observations correctly, the point of the whole exercise is that the interest of the learner is captured and he is given the chance to “see” the event as it happens.


2 comments:
Well presented.
Thanks, amiya. That means a lot, coming from you. I'm a fan of your articles.
Post a Comment